
Wizzflix Data Dashboard: Organisation Insights
Wizzflix's Organisation Insights Dashboard is ideal for quickly viewing organisation-level statistics! 📊
At a glance, you get an overview of the progress and performance of all, making it perfect for regular sharing with the whole company. The handy filters also allow you to easily view quarterly and annual statistics, allowing you to monitor both short-term and long-term performance. It provides the ability to set targets, track performance and spot weakening results in time, allowing you to maintain energy and motivation within the organisation and make targeted adjustments.
What does the Group Insights Dashboard display?
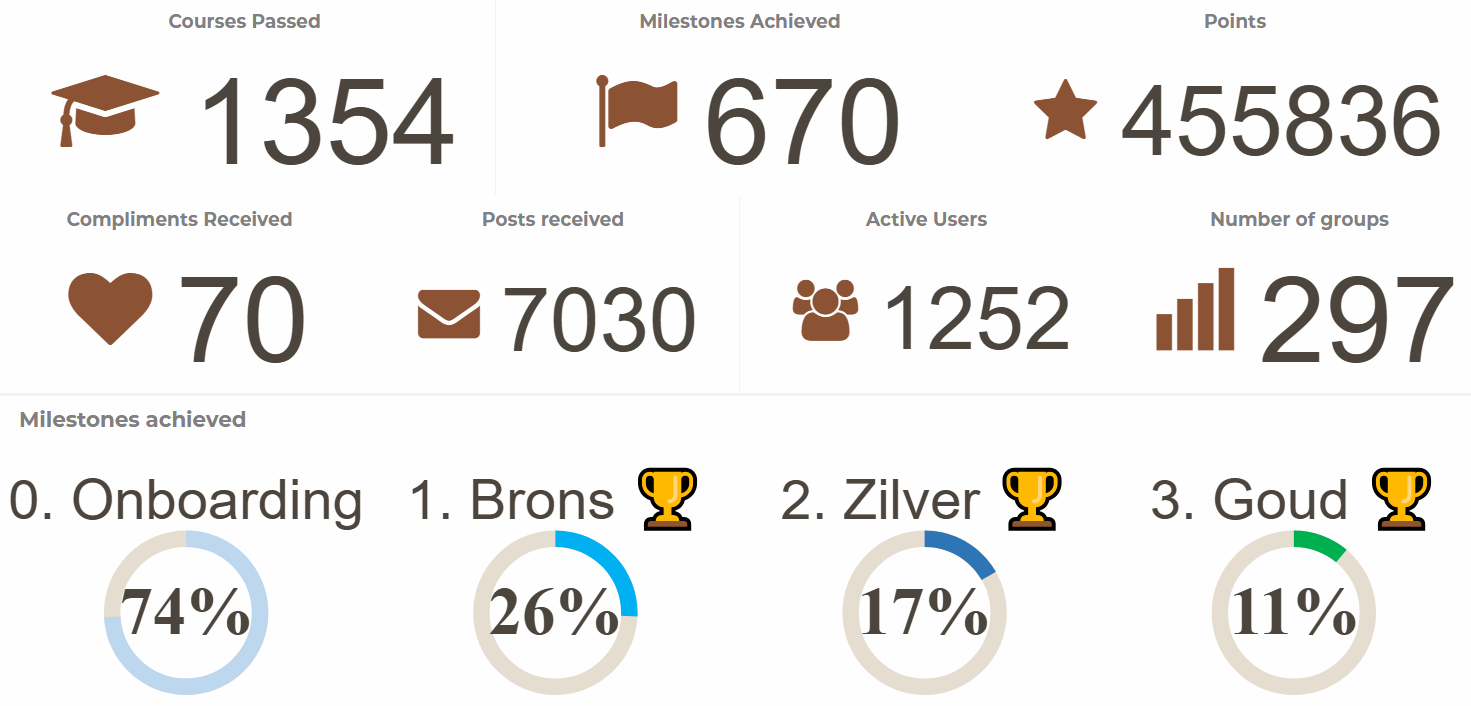
• How many courses have been completed
• How many milestones have been achieved
• How many users are logged in
• How many AppLearning points have been achieved
• How many compliments have been sent
• How many posts have been sent
• How many groups there are in the organisation
✅ Ability to export to Adobe Pdf, Microsoft Excel, HTML and image.
✅ Ability to filter to sort the data by specific criteria such as date.
What does the Organisation Insight Dashboard look like?
How do you retrieve the Group Insight Dashboard?
• Go to console.wizzflix.com
• Log in with mobile phone number
• Go to menu at top right (≡)
• Go to Dashboard
• Click on Team Progress and choose the Organisation Insights dashboard
If you want to find out more about this data Dashboard, send an email to 📬 [email protected] or get in touch with one of the Wizzflix consultants on 📞 0413-280236.